The yarrr package contains a mixture of data, functions
and tutorials supporting the e-book “YaRrr! The Pirate’s Guide to R” (https://bookdown.org/ndphillips/YaRrr/).
To install the (stable) version from CRAN, run the following code
install.packages("yarrr") # install yarrr
library("yarrr") # load yarrr
yarrr.guide() # run main package guide
To install the latest developer version from GitHub, run the following code
# install.packages("devtools") # install devtools if needed
devtools::install_github("ndphillips/yarrr", build_vignettes = TRUE)library(yarrr)
#> Warning: package 'jpeg' was built under R version 4.3.3Once you have installed the package, you can run the main package guide with the following code:
yarrr.guide() # run main package guideHere are the most important parts of the package:
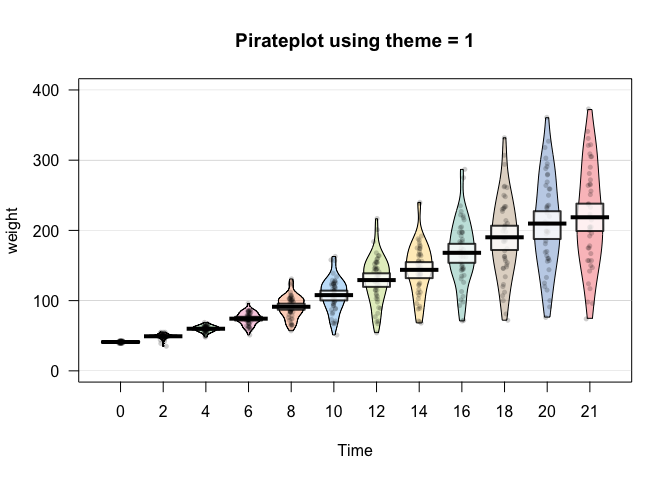
# Create a Pirate Plot using theme 1
pirateplot(
  formula = weight ~ Time,
  data = ChickWeight,
  theme = 1,
  main = "Pirateplot using theme = 1"
)
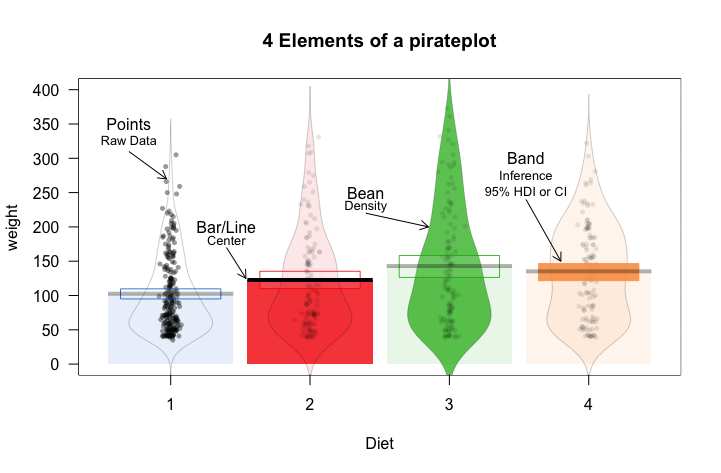
The pirateplot function creates a pirateplot, a
transparent (both literally and figuratively) plot for displaying
continuous data as a function of 1, 2, or 3 discrete variables. Unlike
traditional plots, like barplots and boxplots, the pirateplot shows both
raw data (jittered points), descriptive statistics (line and/or bar),
and inferential statistics (95% Bayesian Highest Density Intervals or
Confidence Intervals), in one plot. While the default plot shows all
these elements, the user can easily customize the transparency of each
element using additional arguments.
piratepal() is a function that returns color palettes.
See ?piratepal for more details
To see all of the palettes, run piratepal("all")
piratepal(palette = "all")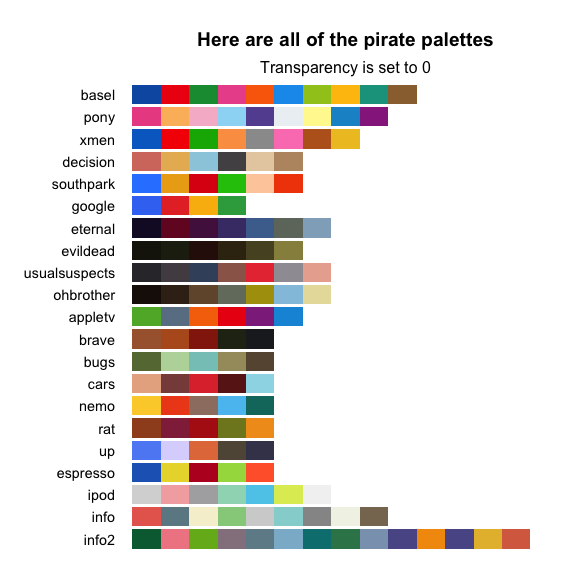
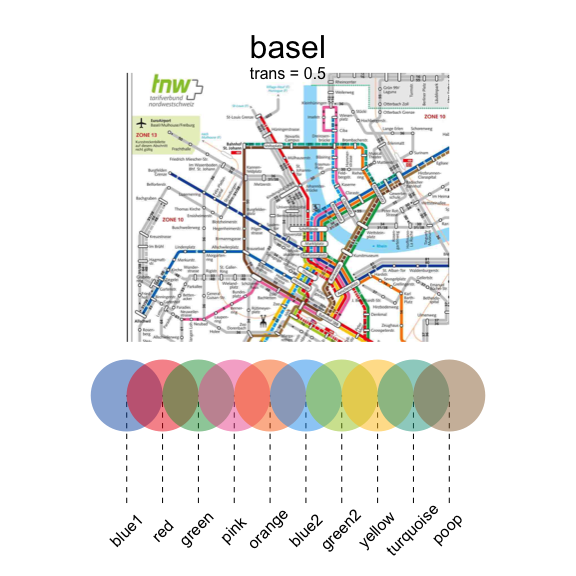
Once you find a palette you’d like to use, you can return the colors
as a vector by specifying the name of the palette in the
palette argument. Here is the Basel palette
piratepal(
  palette = "basel",
  trans = .5,
  plot.result = T
)
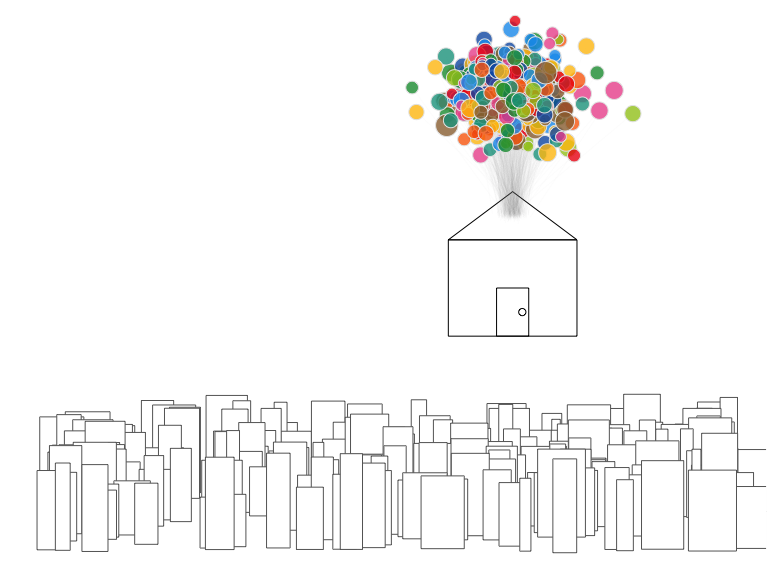
Let’s use the basel palette to draw the house from the Pixar film Up
# Set up balloons
balloon.colors <- piratepal("basel", trans = .2)
balloon.x <- rnorm(500, 0)
balloon.y <- rnorm(500, 4, 1)

par(mar = rep(.1, 4))
plot(1,
  xlim = c(-15, 7), ylim = c(-15, 7),
  xlab = "", ylab = "", type = "n",
  xaxt = "n", yaxt = "n", bty = "n"
)

# skyline
start.x <- runif(200, -15, 7)
start.y <- sort(runif(200, -15, -12), decreasing = T)
heights <- runif(200, 2, 4)
widths <- runif(200, .25, 1.5)

rect(start.x, start.y, start.x + widths, start.y + heights,
  col = "white", border = gray(.4)
)

# house
rect(-2, -6, 2, -2)
polygon(
  c(-2, 0, 2),
  c(-2, 0, -2)
)
rect(-.5, -6, .5, -4)
points(.3, -5)

# strings
line.start.x <- rnorm(500, 0, .2)
line.start.y <- -1 + rnorm(500, 0, .1)
segments(line.start.x,
  line.start.y,
  balloon.x, balloon.y,
  lty = 1, col = gray(.5, .1), lwd = .2
)

# balloons
points(balloon.x, balloon.y,
  pch = 21,
  bg = balloon.colors,
  col = gray(.9), cex = rnorm(100, 2, .3)
)