![]()
![]()
![]()
You can install {gtreg} with the following code.
install.packages("gtreg")You can install the development version of {gtreg} from GitHub with:
# install.packages("devtools")
devtools::install_github("shannonpileggi/gtreg")The {gtreg} package creates tabular data summaries appropriate for regulatory submissions. The package builds the tables using {gtsummary}.
Here are slides and a recorded talk (17 min) from “Introducing {gtreg}: an R package to produce regulatory tables for clinical research” presented at the 2022 R in Medicine conference.

Summarize Raw Adverse Counts
tbl_ae_count() provides counts of all AEs, and omits
percentage statistics as multiple AEs can occur per subject.
library(gtreg)
tbl_ae_count <-
  df_adverse_events |>
  tbl_ae_count(
    ae = adverse_event,
    soc = system_organ_class,
    by = drug_attribution
  ) |>
  add_overall(across = "by") |>
  modify_spanning_header(all_ae_cols() ~ "**Drug Attribution**") |>
  bold_labels()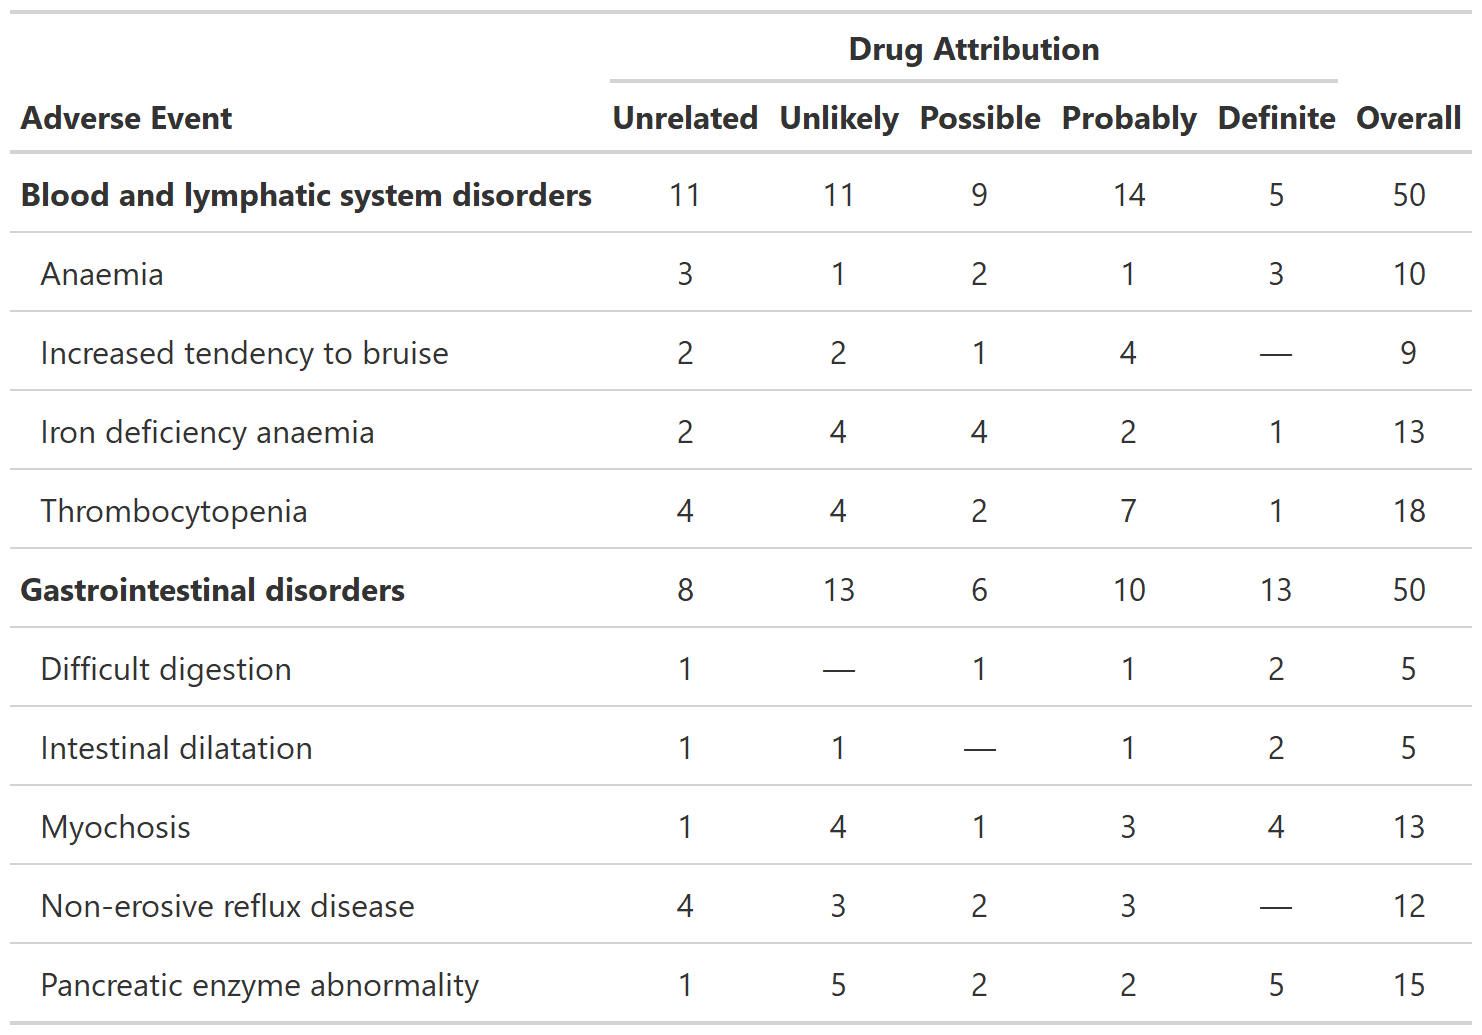
Summarize Adverse Events by Grade
tbl_ae() counts one AE per subject by maximum grade;
percentage statistics are provided by default with the denominators
reflecting the number of patients in the study.
library(gtreg)
gtsummary::theme_gtsummary_compact()
#> Setting theme "Compact"

tbl_ae <-
  df_adverse_events |>
  tbl_ae(
    id_df = df_patient_characteristics,
    id = patient_id,
    ae = adverse_event,
    soc = system_organ_class,
    by = grade,
    strata = trt
  ) |>
  modify_header(all_ae_cols() ~ "**Grade {by}**") |>
  bold_labels()
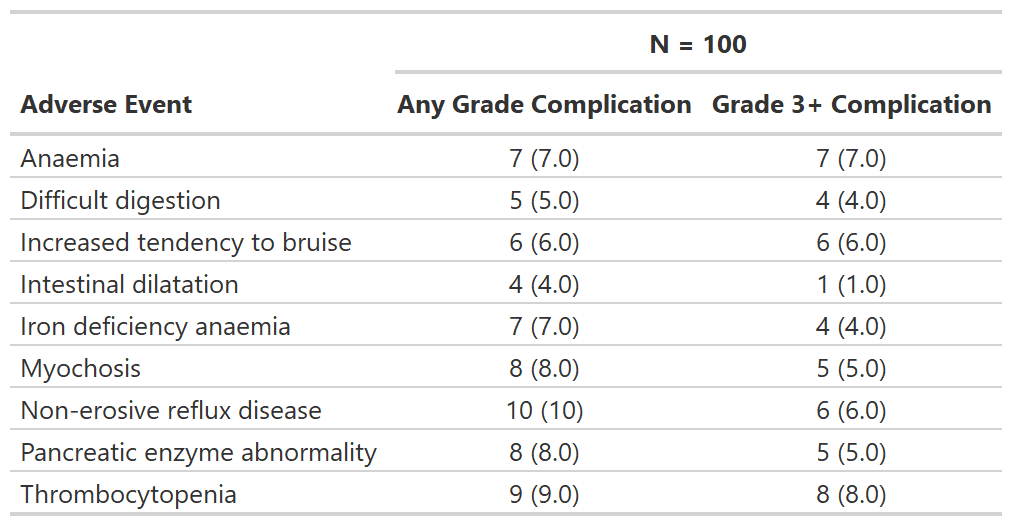
Focus on rates of high grade complications
tbl_ae_focus() also counts one AE per subject by maximum
grade, and is a convenience to summarize dichotomous AE attributes.
tbl_ae_focus <-
  df_adverse_events |>
  tbl_ae_focus(
    id_df = df_patient_characteristics,
    id = patient_id,
    ae = adverse_event,
    include = c(any_complication, grade3_complication)
  )
Regulatory summary
tbl_reg_summary() creates a data summary table often
seen in regulatory submissions.
tbl_reg_summary <-
  df_patient_characteristics |>
tbl_reg_summary(by = trt, include = c(marker, status)) 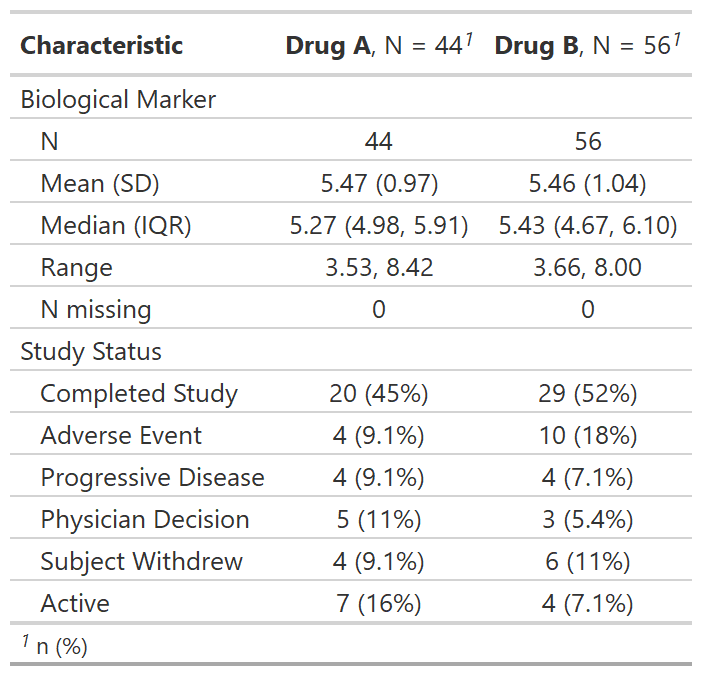
Print an AE listing
tbl_listing() creates a gtsummary-class listing of data
to enable grouped printing.
tbl_listing <-
  head(df_adverse_events, n = 10) |>
  select(system_organ_class, adverse_event, grade, drug_attribution, patient_id) |>
  dplyr::arrange(adverse_event, desc(grade)) |>
  tbl_listing(group_by = system_organ_class) |>
  bold_labels()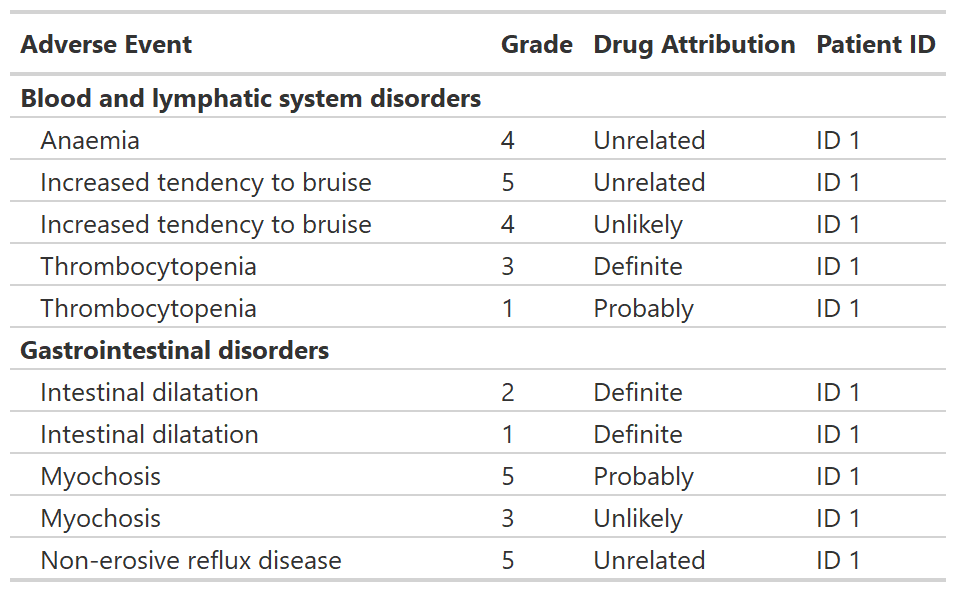
Please note that the gtreg project is released with a Contributor Code of Conduct. By contributing to this project, you agree to abide by its terms.